

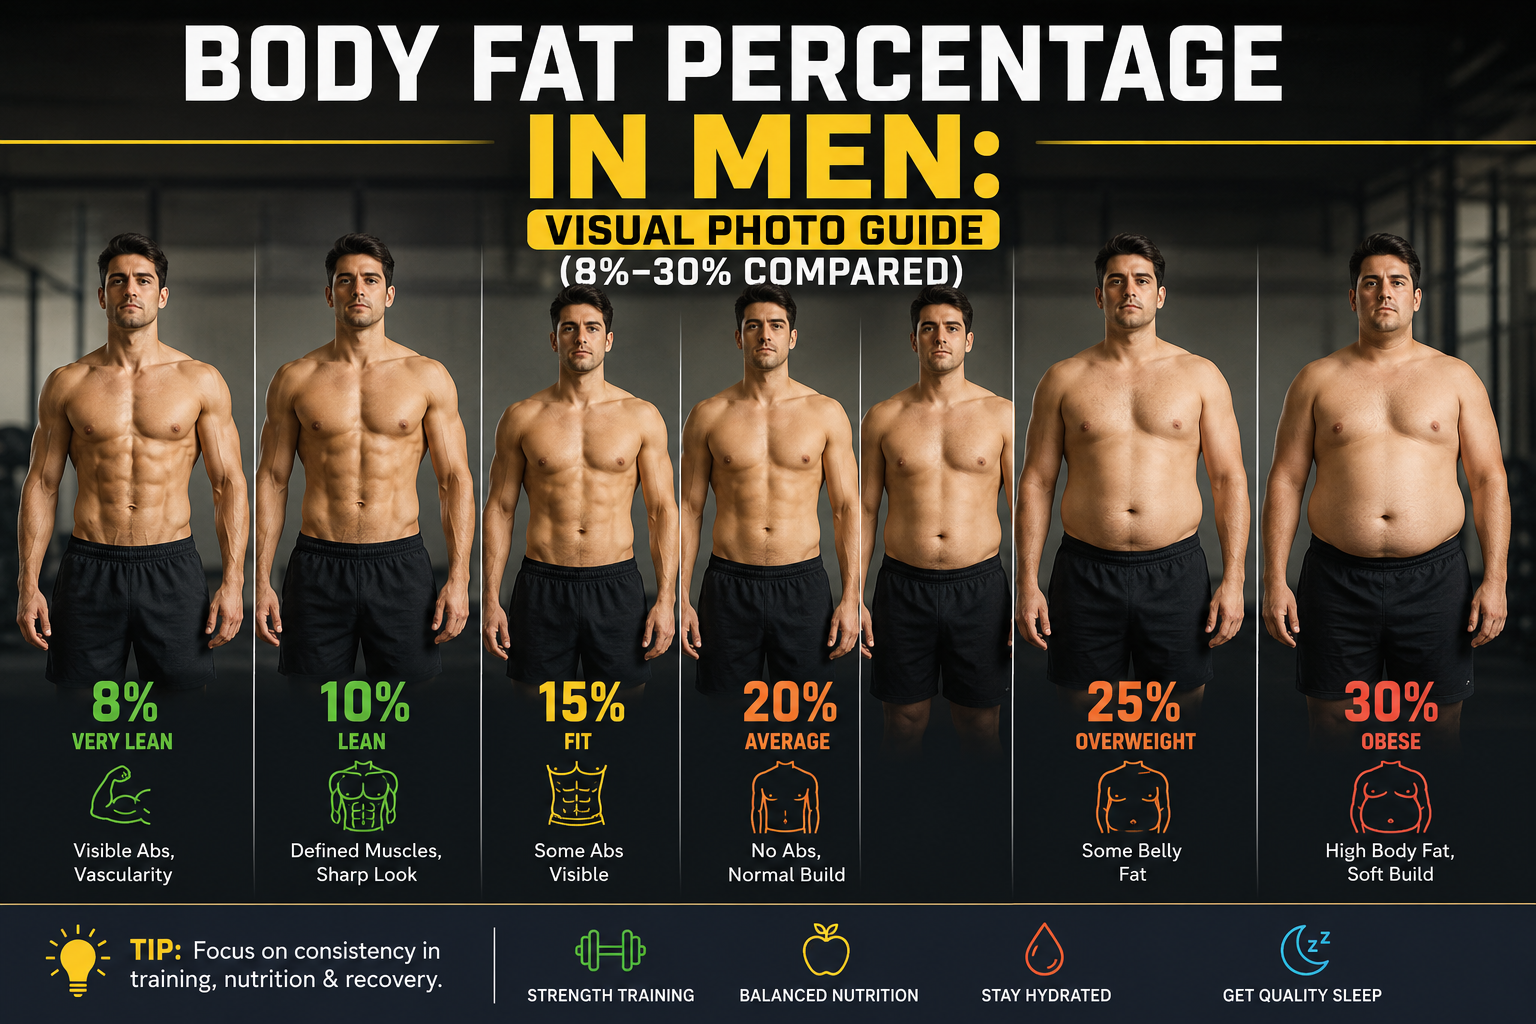
Body fat percentage men track for fitness and health goals typically falls between 8% and 30%. This number matters more than scale weight or BMI, and it’s the most accurate way to understand how your body actually looks and functions. Most healthy men fall between 10% and 20% body fat. Below 10%, abs become visible. Between 10% and 20% is a realistic athletic range. Above 25% is generally classified as overweight to obese. Two men can have the same percentage and still look different. Muscle mass, body type, age, and skin elasticity all play a role. This guide breaks down each range in detail, compares the methods used to estimate it, and shares real training patterns I’ve seen coaching clients through each stage
WHAT: What Is Body Fat Percentage, and What Does Each Range Look Like?
What Body Fat Percentage Actually Measures
Body fat percentage measures how much of your body weight is fat. The rest is muscle, bone, water, and organs. This number is more useful than BMI. BMI only looks at height and weight. It can’t tell muscle from fat. A bodybuilder and a sedentary man can weigh the same. Both might show as “overweight” on a BMI chart. Their body fat percentages can differ by 20 points.
Coach’s Note: The first time a client of mine saw his BMI flagged as “overweight” despite training five days a week, he nearly gave up on tracking anything. A DEXA scan a week later put him at 14% body fat. BMI never should have been the number he trusted in the first place.
What Each Body Fat Percentage Range Looks Like
Use the table below as a quick reference. Read the detailed breakdown after for what each range looks like on the body.
| Body Fat % | Common Description | Visible Traits |
|---|---|---|
| 4–6% | Competition / essential fat | Full muscle separation, visible striations, very low energy reserves |
| 8–10% | “Beach lean” | Visible six-pack, minimal love handles, defined jawline |
| 12–15% | Athletic | Abs visible with some definition, faint ab separation |
| 17–20% | Average fit | Abs mostly hidden, some midsection softness |
| 22–25% | Skinny-fat / soft | Waist widens, no visible ab definition |
| 28%+ | Obese range | Fat accumulation across abdomen, chest, and lower back |
4–6% — Competition or Essential Fat. This is the leanness level seen on stage at bodybuilding competitions. It sits at the edge of essential fat. Essential fat is the minimum fat the body needs for hormones and organ function. Muscle striations show even at rest. Vascularity increases across the shoulders and arms. The lower back and glutes show deep separation. This look is often called the “Christmas tree” back. This level is not sustainable year-round.
8–10% — “Beach Lean.” This is the range most people picture when they imagine a lean, fit physique. The six-pack shows clearly under normal lighting. Love handles are minimal. The jawline shows clear definition. This range is achievable. Disciplined, consistent trainers can sustain it long-term.
12–15% — Athletic and Defined. Abs are visible but softer around the edges. The sharp separation seen at single-digit percentages is missing. This range is realistic and maintainable. Most active men can reach it without strict dieting.
17–20% — Average Fit. Abdominal definition mostly disappears under a layer of fat. The overall silhouette still looks athletic and proportionate. This range is common among men who train regularly for strength or general fitness. They don’t diet specifically for visible abs.
[Image placeholder: front and back comparison, 18% body fat]
22–25% — Skinny-Fat or Soft. The waist visibly widens. Abdominal fat accumulates. This happens even in men who aren’t significantly overweight by scale standards. Scale weight alone won’t reveal this mismatch.
28% and Above — Obese Range. Fat accumulates noticeably across the abdomen, chest, and lower back. Health standards generally classify this range as obese. Most fat-loss programs start from this point.
Comparison: Visual Guide vs. Other Estimation Methods
A photo guide is only one tool among several. Here’s how it stacks up against the most common ways men estimate body fat.
| Method | Best For | Weakness |
|---|---|---|
| Visual photo comparison | Quick, free, no equipment needed | Skewed by lighting, pump, and camera angle |
| Navy body fat calculator (tape measurement) | Fast, consistent, low cost | Less accurate on very lean or very muscular men |
| BIA smart scale | Daily tracking, trend spotting | Swings with hydration; not reliable for a single reading |
| Skinfold calipers | Cheap, decent accuracy with practice | Highly technique-dependent, hard to self-administer |
| DEXA scan | Most accurate, breaks down regional fat | Costs money, requires a clinic visit |
In my experience, the most reliable approach isn’t picking one method. It’s using a visual guide for a quick gut-check, a tape measurement for weekly tracking, and a DEXA scan every few months to recalibrate both. Relying on any single method long-term tends to drift out of accuracy — BIA scales especially, since a salty meal the night before can shift the reading by 2–3%.
WHY: Why Two Men at the Same Body Fat % Can Look Completely Different
Most visual guides skip this part. It explains why eyeballing body fat from a single photo is never fully reliable.
Why muscle mass changes the picture. Body fat percentage tells you what fraction of your weight is fat. It says nothing about your muscle mass. A man with more muscle at 15% body fat looks more defined than a man with little muscle at the same 15%. More muscle means more shape under the fat layer. This is why trained lifters look leaner than untrained men at the same percentage.
Why body type matters. Genetic frame affects where fat gets stored. It also affects how visible your muscle becomes at a given percentage. Naturally lean-framed men, called ectomorphs, often show visible abs at higher body fat percentages. Heavier-framed men, called endomorphs, tend to store fat around the abdomen. This happens regardless of overall leanness.
Why age changes the appearance of leanness. Skin thickness and elasticity change with age. A 45-year-old man at 15% body fat typically shows less sharp definition than a 22-year-old at the same percentage. Younger men have thinner, more elastic skin. This skin reveals muscle shape more clearly. Few guides mention this. It’s a major reason identical percentages look different across age groups.
Why this matters more than the number on the scale. Two men can weigh the same and look completely different. Weight alone doesn’t distinguish between muscle, fat, and water. Track body fat percentage if your goal is how you look and feel. Don’t just track the number on the scale.
Pair this understanding with a structured training routine. Progress becomes far more consistent. Our home workout guide for men is a solid starting point if you don’t have gym access.
Case Studies: Real Training Patterns Across Body Fat Ranges
“Rohan,” early 30s — stuck at 22% despite consistent gym visits. He trained four days a week but never changed his diet. His scale weight barely moved for a year, which he read as “not overweight.” A body fat scan told a different story. Once he started tracking food intake alongside training, he dropped to 16% in four months. His weight only changed by six pounds — the visible transformation came from body composition, not the scale.
“Daniyal,” late 20s — hit 11% for a wedding, couldn’t hold it. He reached beach-lean condition through an aggressive cut. Within two months of returning to normal eating, he settled back at 17–18%. This is a pattern I see constantly: single-digit and low-teens body fat is achievable short-term, but very few men sustain it year-round without ongoing strict tracking.
“Marcus,” 45 — 15% body fat, but visually softer than a 24-year-old at the same reading. He trained hard and his scans confirmed 15%. But his definition looked closer to what a 20% reading shows on a younger man. This wasn’t a measurement error — it reflected the skin elasticity difference covered above. It’s a good reminder that a number alone doesn’t fully describe a physique.
HOW: How to Estimate and Measure Your Body Fat Percentage
How to Estimate It Visually
Visual estimation is a starting point, not a precise measurement.
- Compare your midsection first. The abdomen is the most reliable visual indicator for most body types.
- Check for ab separation under flat, even lighting. Harsh overhead lighting can make higher body fat look more defined than it is.
- Look at love handles and lower back fat, not just the front of the stomach.
- Avoid judging from a single “pumped” post-workout photo. Muscle fullness after exercise can make body fat look lower than it actually is.
How It’s Measured Accurately
| Method | Accuracy | Accessibility |
|---|---|---|
| DEXA scan | Very high | Requires clinic visit, moderate cost |
| Hydrostatic weighing | Very high | Rare, lab-only |
| BodPod | High | Limited availability |
| Skinfold calipers | Moderate (technique-dependent) | Cheap, widely available |
| BIA (smart scales) | Low–moderate | Very accessible, hydration-sensitive |
DEXA scans are the most practical gold-standard option available to the public. They offer lab-grade accuracy. The cost is a fraction of hydrostatic weighing. Calipers and BIA scales are far more accessible. Their results can vary by several percentage points. Hydration, technique, and the equation used all affect accuracy. This is why so many people have a distorted sense of what a given body fat percentage should look like.
Coach’s Note: I ask every client to get one DEXA scan before starting a program, even if they plan to track with a cheap BIA scale afterward. That first scan becomes the reference point everything else gets calibrated against.
How to Avoid Common Judging Mistakes
- Confusing muscle tone with leanness. A well-developed physique can look “cut” under good lighting without being especially lean.
- Ignoring water retention. Sodium and carb intake can shift visual leanness by several perceived percentage points day to day.
- Using a single reference photo instead of a range. Lighting angle alone can exaggerate a 1–2% difference.
- Comparing across body types. Frame size, height, and natural fat distribution all change the picture.
My Take: What Actually Matters for Beginners
If you’re new to tracking body composition, don’t chase single-digit body fat as a starting goal. In my experience, most men who try to jump straight to “beach lean” burn out within a few months and end up heavier than when they started. The 12–17% range is where most sustainable transformations actually happen — visible progress, without the constant food-weighing and dehydration tricks that single-digit leanness demands.
My honest feedback after watching dozens of men go through this: pick one accurate baseline measurement, train consistently for 8–12 weeks, and re-test with the same method. Progress photos in the same lighting, same time of day, matter more than any single body fat number.
Frequently Asked Questions
What is a healthy body fat percentage for men? Most men fall in a healthy range between 10% and 20% body fat. Organizations like the American Council on Exercise use this standard. Athletes often sit lower. A sedentary lifestyle tends to push this number higher.
What does 15% body fat look like on a man? At 15% body fat, most men show faint ab definition. Some softness remains around the midsection. The abs are visible but not sharply separated. This range is realistic and sustainable for active men who train regularly.
What’s the lowest safe body fat percentage for men? Essential body fat for men is generally 3% to 5%. Dropping below this range for long periods can affect hormone production and overall health. This is why competition-level leanness only lasts short-term.
Is body fat percentage more accurate than BMI? Yes. BMI only factors in height and weight. It can’t distinguish between muscle and fat mass. Body fat percentage directly measures body composition. This makes it a more accurate indicator of fitness and health risk.
Can two men have the same body fat percentage but look completely different? Yes. Muscle mass, body type, age, and skin elasticity all affect how a body fat percentage looks. The underlying number can be identical. The visual result is not.
How is body fat percentage measured accurately? DEXA scans, hydrostatic weighing, and BodPod testing are the most accurate methods. Skinfold calipers and BIA smart scales are more accessible. They are less precise. Results can shift with hydration and technique.
Building a leaner, more defined physique takes consistent training. It also takes understanding your starting point. Check out our home workout guide for men to pair with this visual reference
